Reactive acronym list in stratvis, a timevis-based Shiny app
TweetAbstract
I present a method for reactively updating a table of acronyms from a Shiny interactive timeline using renderDataTable and timevis. The method is used in the new Shiny app, stratvis.
The stratvis app
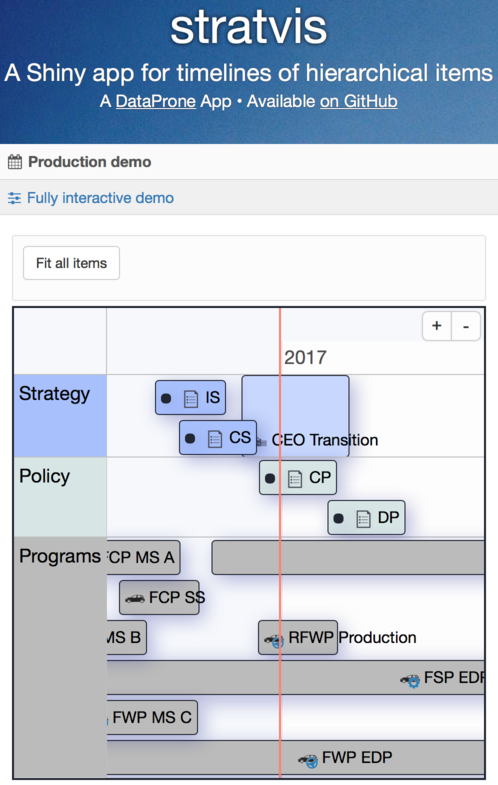
The stratvis Shiny app provides a rich and fully interactive timeline
visualization of hierarchical items (e.g. strategy, policy, guidance, goals,
objectives, milestones, decisions) for a strategic view of organizational
activity. The app uses the timevis R package, which is based on
the vis.js Timeline module and the
htmlwidgets R package. For convenience, I’ve hosted
a demo of stratvis on
my Shiny server, so you can scroll through the interactive
timeline and watch the acronym list adjust automatically.
Relevant background on the timevis API
When a timeline widget is created in a Shiny app with the timevis method, four Shiny inputs
are also created (and updated as the interactive timeline is manipulated within the app).
The names of the inputs are based upon the name given to the timeline object (with _data,
_ids, _selected, and _window appended). We will use the _data and _window appended
objects in our
method to build the reactive acronym list below.
If the interactive timeline object is timelineGroups (as it
is in the stratvis demo), then the following input variables are available:
-
input$timelineGroups_data- will return a data.frame containing the data of the items in the timeline. The input is updated every time an item is modified, added, or removed. -
input$timelineGroups_window- will return a 2-element vector containing the minimum and maximum dates currently visible in the timeline. The input is updated every time the viewable window of dates is updated (by zooming or moving the window).
Reactively update acronym list
The block of code in server.R that generates the reactively updated acronym list:
output$acronyms <- DT::renderDataTable({
    firstDate <- input$timelineGroups_window[1]
    lastDate <- input$timelineGroups_window[2]
    data <- input$timelineGroups_data %>%
      select(content,type,start,end) %>%
      filter(((type == 'point' | type == 'box') &
              (start > firstDate & start < lastDate)) |
             ((type == 'range' | type == 'background') &
              (start < lastDate & end > firstDate)))
    acronyms %>%
      filter(grepl(
        paste0("\\<",
               paste(
                 unlist(
                   str_split(data$content,pattern=" ")),collapse="\\>|\\<"),
               "\\>"),
        acronym)) %>%
      select(acronym, full)
  },
  options = list(
    paging = FALSE,
    order = list(list(1, 'asc')),
    rownames = FALSE,
    columnDefs = list( list(visible=FALSE,targets=0) ),
    colnames = c("Acronym","")
  )
)
Obviously, the core functionality is provided by the renderDataTable
method, which makes a reactive version of a function that returns a data
frame (or matrix) to be rendered with the DataTables library.
As mentioned above, the timelineGroups object is the actual timevis interactive timeline
object, and the following code ensure that the acronyms Shiny output is
reactively updated whenever the timelineGroups_window Shiny
input changes (i.e. when the minimum or maximum date in the visible timeline
window changes):
firstDate <- input$timelineGroups_window[1]
lastDate <- input$timelineGroups_window[2]
The content, type, start, and end variables within the timelineGroups_data Shiny
input are selected and then filtered for only those items visible in the timeline:
data <- input$timelineGroups_data %>%
  select(content,type,start,end) %>%
  filter(((type == 'point' | type == 'box') &
          (start > firstDate & start < lastDate)) |
         ((type == 'range' | type == 'background') &
          (start < lastDate & end > firstDate)))
The call to filter accomodates ‘point’ and ‘box’ type objects (type = 'point' or
type = 'box') that do not have end dates (end = NA) as well as ‘range’ and ‘background’
type objects (type = 'range' or type = 'background'). Note that this approach
would also update the acronym list if an item is added interactively to the timeline.
Each row of the acronyms data frame is an acronym (acronym variable) and
the full phrase to which it corresponds (full variable). The following code uses
grepl to filter acronyms down to only those items present in the data object
created above. The regular expression used in the call to grepl is simply
all of the words (separated by white space) in data$label pasted together with
“|” characters between them.
acronyms %>%
  filter(grepl(
    paste0("\\<",
           paste(
             unlist(
               str_split(data$content,pattern=" ")),collapse="\\>|\\<"),
           "\\>"),
    acronym)) %>%
  select(acronym, full)
Note: my original code had an error in the grepl regular expression. It did not
include the \\< and \\> tags, resulting in matches when any part of an acronym
was present in the timeline. Thanks to Dean Atalli
for pointing this out.
Feedback welcome
If you have any feedback on the above approach or the stratvis app in general, please leave a comment below or use the Tweet button. As with any of my projects, feel free to fork the stratvis repo and submit a pull request if you wish to contribute.